Did you have troubles or issues with your SharePoint pages because they take too much time to load and you wanted to check where the problem is? Or did you wonder what’s going on behind the scenes or what SharePoint did during the page load? You don’t have to think too much about all that, you just need to know some details about the developer dashboard utility in order to get it working and enabled and then, once it’s done, you can monitor all your SharePoint pages.
It’s disabled by default (Off) so first of all we need to enable it on the web server. It means that you should have the required permissions to configure and update its settings.
We can choose to get it enabled all the time (On) or when needed only (OnDemand).
The question now is how to enable this utility and update its configuration settings.
We can do that using (1) the stsadm command line, or with (2) Powershell or, if you prefer to write some code to do it (3) programmatically, that’s possible also but this time you don’t even need to launch visual studio because I already did that for you, so you just need to install and use the web part in the solution file attached to this post from the central administration.
1) Using the stsadm command line, the command is the following :
stsadm –o setproperty –pn developer-dashboard –pv [on|off|ondemand]
To get the current setting and check whether it’s enabled or not we can use this command:
stsadm –o getproperty –pn developer-dashboard
2) Using PowerShell
We can use any PowerShell script editor to write the following script to enable the developer dashboard using the “OnDemand” mode:
The first line is to load the SharePoint PSSnapin, we need to do so in order to execute the SharePoint PowerShell commands. Once done, we access the developer dashboard settings and set its “DisplayLevel” property to “OnDemand”, otherwise we can make “On” if we want to get it enabled all the time or “Off” to disable it, if it is already enabled.
We will save the file using the “.ps1” extension so we can run it later from a batch file. (just to show you how can we do that, that should be helpful when you write PowerShell script to automate SharePoint solutions deployment for example or when you need to achieve known configuration tasks, this way you just need to prepare your .bat files with the required PowerShell scripts and use them later any time you need to do so)
I will call them respectively “DevDSB.ps1” and “EnableDevDSB.bat”, keep them in the same folder and add the following content in the .bat file to execute, once clicked, the “DevDSB.ps1” file.
That’s it! Right click the “EnableDevDSB.bat” file and click “Run as Administrator”, wait for few seconds until SharePoint executes the command and you will get your developer dashboard enabled.
3) Enable developer dashboard programmatically with code
To do it programmatically we need to use “Microsoft.SharePoint.Administration” namespace and to run the code from central administration. We just need 3 lines of code to get it enabled as shown below:
We access as we did with PowerShell the developer dashboard settings and we update its “DisplayLevel” property using the desired mode.
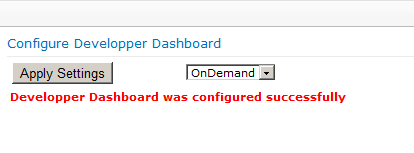
The attached solution, once installed on your server central administration, will allow you easily to configure the developer dashboard settings. You just need to select the desired mode to apply from the drop down list, click “Apply Settings” button and it’s done.
Check your central administration site collection scoped features and you should find the following feature, get sure that it’s activated. (It will be automatically activated once the solution is deployed to the central administration site, but check it if you don’t find the web part under custom group)
Select “OnDemand” option from the drop Down List an click “Apply Settings”.
Check your SharePoint site, you should notice an icon at the upper right side of the page used to enable\disable the developer dashboard as needed.
Click it and you will get the developer dashboard enabled as shown below.
We can see at the left part the url of the current page that was requested and then all the functions that were called and required to load and render the page content and for each one how much time it took. Here I was loading the home page for a team site, notice the shared documents web part and the image web part for example that were loaded and added to the page.
Check all the other data displayed on the figure like the database queries that were executed (click the link and you will get more details about the query), the current logged in user, the execution time, there’s also the event correlation token in the logs and the web parts events.
That’s it! Now you can understand easily what SharePoint did before your page gets displayed and when it’s loading.
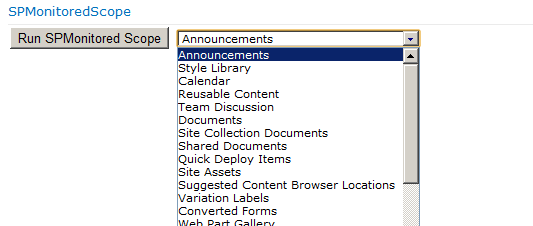
You can even monitor the performance of your page with code using the developer dashboard, from custom web parts for example or whatever you put in your page. We can do that using the “Microsoft.SharePoint.Utilities” namespace and the “SPMonitoredScope” class as in the following figure.
I’m using “Microsoft.SharePoint” and “Microsoft.SharePoint.Utilities” namespaces in the same class that’s why visual studio gets confused and it used the constructor in the “Microsoft.SharePoint” namespace, so I choosed to call the second namespace “Utility” and to use it this way.
using Microsoft.SharePoint;
using Utility = Microsoft.SharePoint.Utilities;
I’m enumerating the lists in the site and I display them in the drop down list as a simple example.
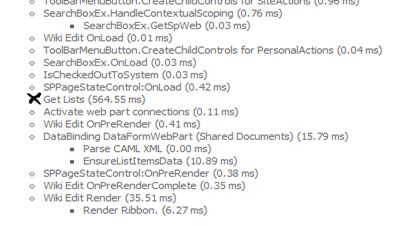
Check the developer dashboard displayed data again and you will see your monitored scope, called “Get Lists” in our sample, and how much time it takes to add the lists to the drop down list.
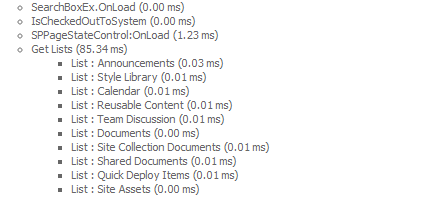
We can use nested monitored scopes too. (In our sample we can add another monitored scope before we add the list title to the drop down list to get an output as the following)
I’m using a simple example to demonstrate how to call the “SPMonitoredScope” class but that can be more useful in other situations when you really need to monitor every scope or every part of your code because you don’t know where the problem is and why your page takes too much time to load. Hope that will be helpful in such situations!


